
The Lucent360â„¢ LED modules and vial holders/reactors are designed to be interchangeable, giving users the freedom to create custom experimental setups tailored to their specific needs. With adjustable wavelengths, variable light intensities, customizable vial arrangements, and temperature control, the system offers an almost limitless range of possibilities for optimizing reactions. This flexibility makes it easier to explore reaction parameters at a small scale, which is crucial when planning for larger-scale production using the same instrument.
A great example of the system's adaptability can be seen in the screening of catalyst concentrations and light intensity for an iridium-catalyzed C-C bond formation reaction (see Figure 1).
Figure 1:
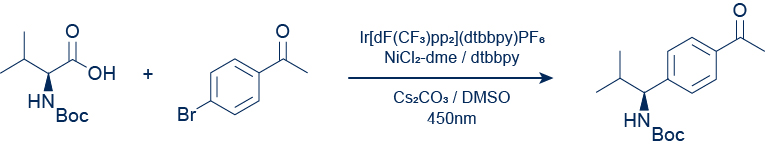
Using the Lucent 360™ multi-light screener (HCK1021-01-010), which can run 16 reactions simultaneously across four different wavelengths and light intensities, a detailed screen was conducted at 450 nm. Four different iridium catalyst concentrations (1 mol%, 0.5 mol%, 0.1 mol%, and 0.01 mol%) were tested with four distinct light intensities. Based on actinometry experiments carried out in 2 mL reactions, each setting corresponds to effective power levels ranging from 0.25 W to 1.2 W, translating into photon fluxes between 9.5×10⁻⁷ and 4.5×10⁻⁶ Einstein/s (moles of photons per second).
|
Effective Power/Reaction (W)
|
(+/-) |
Photon Flux (Einstein/s) |
| Quadrant 1 |
1.21 |
8.4% |
4.54E-06 |
| Quadrant 2 |
1.05 |
8.3% |
3.94E-06 |
| Quadrant 3 |
0.54 |
6.0% |
2.03E-06 |
| Quadrant 4 |
0.25 |
4.1% |
9.50E-07 |
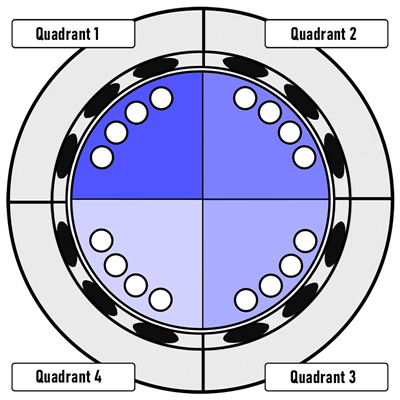
Below is a summary of the effective power and photon flux for each quadrant:
|
Effective Power/
Reaction (W) |
(+/-) |
Photon Flux (Einstein/s) |
| Quadrant 1 |
1.21 |
8.4% |
4.54E-06 |
| Quadrant 2 |
1.05 |
8.3% |
3.94E-06 |
| Quadrant 3 |
0.54 |
6.0% |
2.03E-06 |
| Quadrant 4 |
0.25 |
4.1% |
9.50E-07 |
The multi-light intensity/catalyst screen followed this protocol (Table 1): Each 4 mL vial equipped with a Teflon septum and stir bar was filled with a solution containing 1.1 mg Ni-glyme (5 mol%, 5 µmol) and 1.3 mg dtbbpy (5 mol%, 5 µmol) in methanol. The solvent was removed under reduced pressure (16 vials). Then, 48.9 mg Cs₂CO₃ (1.5 equiv., 150 µmol) was added under inert atmosphere, and the vial was capped. A 1 mL sparged solution in DMSO containing 19.9 mg bromoacetophenone (100 µmol), 35.6 mg Boc-Val-OH (1.5 equiv., 150 µmol), and 7.7 mg biphenyl (0.5 equiv., 50 µmol) as an internal standard was added. Ir(dF-CF₃-ppy)₂(dtbbpy) was introduced as a DMSO solution to achieve 0.01, 0.1, 0.5, or 1 mol% catalyst. Additional DMSO was added to bring the total volume to 2.0 mL. Reactions were performed at 30°C in the Lucent360™ using 450 nm LEDs. Samples were taken at 5, 15, 30, and 60 minutes for LC-MS analysis (10 µL diluted to 1 mL in DMSO).
Table 1 : Experimental Details (for standard conditions)
| Reagent |
Equivalent |
Amount (µmol) |
0.05 |
M |
| bromoacetophenone |
1 |
100 |
19.9 |
mg |
| boc-Val-OH |
1.5 |
150 |
32.6 |
mg |
| Ir(dF-CF3-ppy)2(dtbbpy) |
0.01 |
1 |
1.1 |
mg |
| Ni-glyme |
0.05 |
5 |
1.1 |
mg |
| dtbbpyp |
0.05 |
5 |
1.3 |
mg |
| Cs2CO3 |
1.5 |
150 |
48.9 |
mg |
| Biphenyl |
0.5 |
50 |
7.7 |
mg |
| solvent |
DMSO |
0.05M |
0.002 |
L |
Monitoring the reaction over 60 minutes revealed clear trends in product formation based on catalyst concentration and light intensity (Table 2). Reactions with 1 mol% Ir catalyst showed similar conversions (62–65%) at 60 minutes regardless of power settings. At 0.5 mol% catalyst, 0.54 W or higher was sufficient to reach similar conversion rates. Lower catalyst loadings significantly reduced conversion, regardless of the light intensity used.
Tableau 2 : Conversion at 60 minutes
|
Power (%) |
| Ir cat (mol%) |
0.25W |
0.54W |
1.05W |
1.21W |
| 1 |
62.0 |
63.5 |
65.6 |
65.2 |
| 0.5 |
47.8 |
65.1 |
67.7 |
65.8 |
| 0.1 |
15.7 |
33.7 |
45.2 |
47.7 |
| 0.01 |
1.0 |
0.2 |
2.6 |
2.6 |
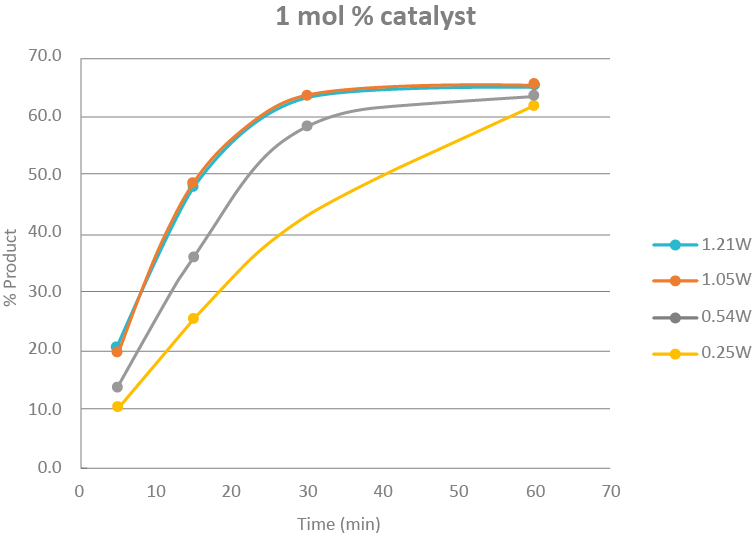
While the final conversion is similar for the conditions highlighted in green in Table 2, there were noticeable differences in the initial reaction rates and time to completion (Figure 3). Both reactions at 1.0 W and 1.2 W were completed within 30 minutes, with minimal additional product formation, whereas the lower power settings required the full 60 minutes to complete.
Figure 3: Plot of time course for 1 mol % at 0.25W, 0.54W, 1.05W, and 1.21W
Based on these results, the reaction can be successfully performed with 0.5 mol% photocatalyst at 0.54 W, achieving similar conversions as with higher catalyst loadings and light intensities—though at a slower rate.
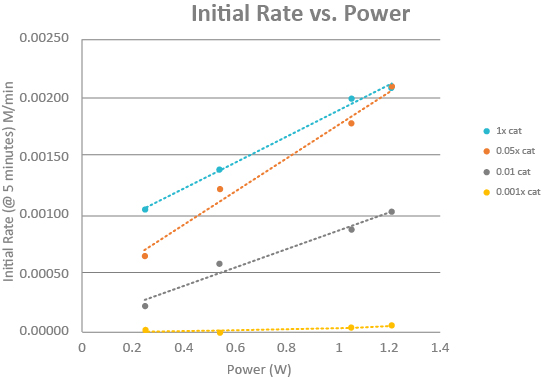
Figure 4: Plot of time course for 0.54 W setting with 4 catalyst concentrations
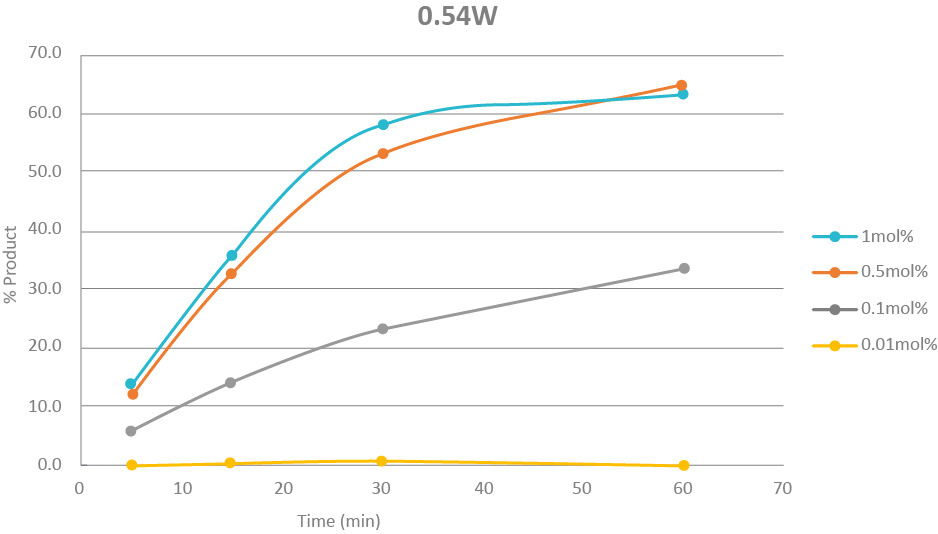
Looking at the initial rate at 5 minutes, we clearly see the significant impact of light intensity on the reaction. Increasing the initial rate is a key factor when determining optimal conditions for scaling up a photochemical reaction. For this particular C-C bond formation, while we're not entirely sure yet, we do know that without the easy setup of the Lucent360™ and its ability to monitor multiple light intensities simultaneously, gathering all this data would have taken much longer. For our next experiment, we could test different nickel co-catalyst concentrations at each light intensity compared to the 0.5 mol% iridium catalyst, or even try new wavelengths like 365 nm, 380 nm, or 405 nm, or adjust substrate concentrations. Whatever we decide, we’re confident it will be straightforward with the Lucent360™.
Figure 5 :
Know more:
- Contact us:
- Acess directly to the Lucent360â„¢ from Hepatochem on our website.
- Follow our news on LinkedIn
Fish Fillet
Fish Fillet
Fish Fillet,Crusted Cod,Hake Fillets For Sale,Salmon Fish Fillet
ZHEJIANG EVERNEW SEAFOOD CO.,LTD , https://www.evernewseafood.com